
This project entailed familiarising myself with Digimap and Arcmap. I selected the same area of interest as Project 1, the Devil’s Jumps, and made use of knowledge I acquired as an interpreter. Within this project, I became acquainted with the following: OS and Historic maps, layering rasters and vectors, mosaicing and other GIS processes. The historic maps were of particular interest, as they dated back further than satellite imagery from Google Earth; this meant my analysis on changes in the site could incorporate a larger time frame.
Using Digimap and Arcmaps, I expanded on my research of the Devil’s Jumps. Mapping is a visual information platform which allows the presentation of raw data in multiple ways. Digital mapping became prominent between 1970 and 1990, whilst satellite and GPS accelerated between 1985 and 2000. Despite the take-off of digital mapping, the underlying cartographic principles remain the same: location, attributes, scale, and dimensional change all continue in being paramount to an accurate and detailed map.
The process began with data acquisition from Digimap as I needed a background raster map and building outline data. There are many scales for raster mapping but as the area I have chosen is small, I needed a larger scale. From digimaps, I downloaded County Series (1st, 2nd and 3rd Revisions) and a contemporary ordnance survey map. I selected features of interest and used a 1:2000 Master Map raster; this ensured I had a useable scale range for my chosen section. Once uploading the rasters into ArcMap, I mosaicked them; mosaicking in GIS creates a single raster dataset out of multiple datasets, which makes it easier to use other GIS tools.
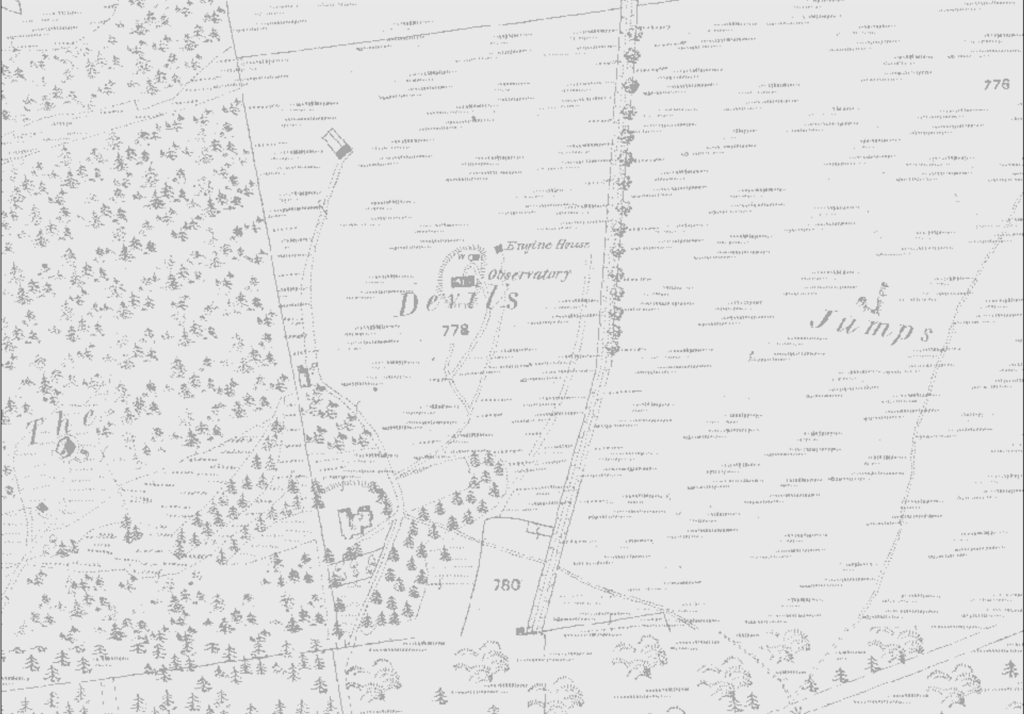
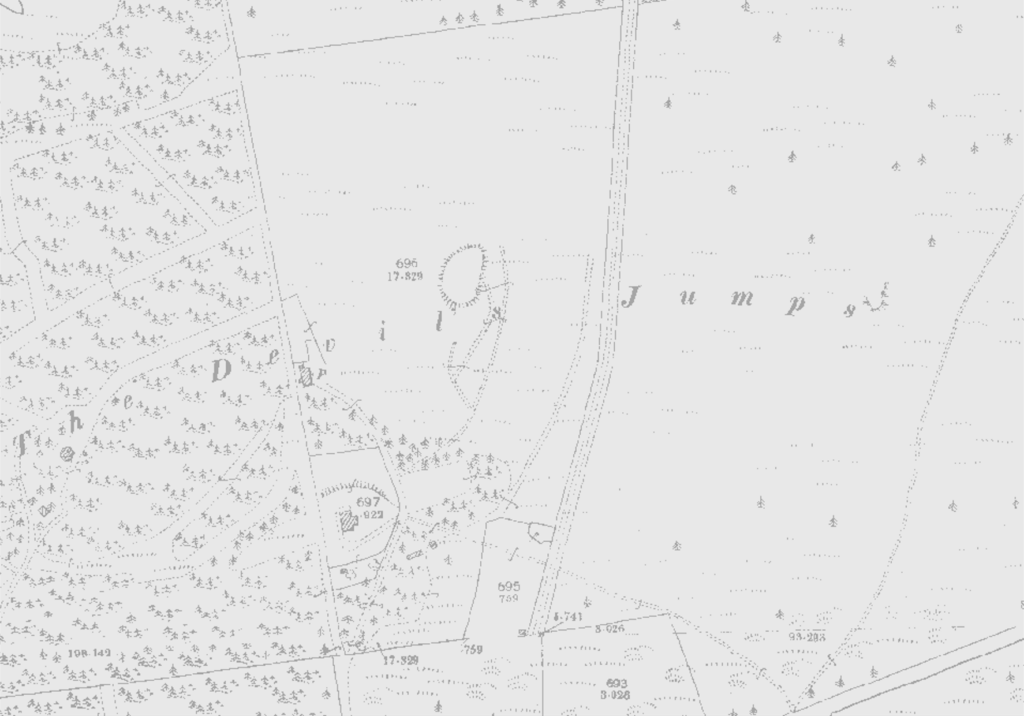
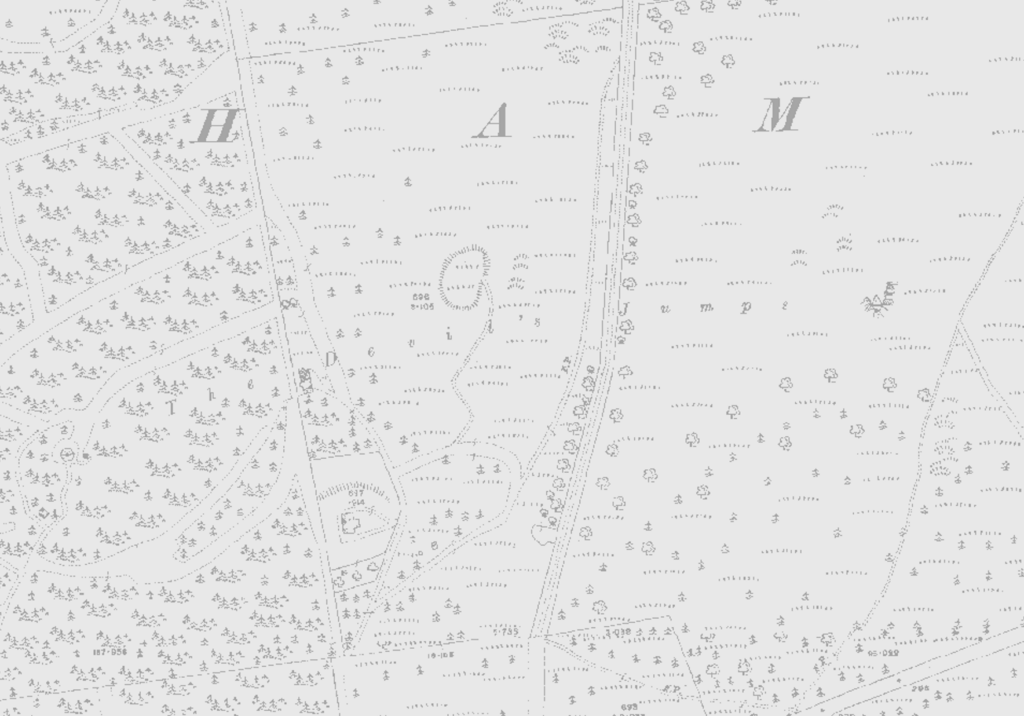
Maps are a representation of the real world; in this project, they have been used to detail changes in the site over time, assisted by the readability and accuracy of the maps. Each of the foreground layers in Figures 4-7 are from different historic maps; 1846-1899, 1888-1914 and 1922-1969. (Figures 1-3 show these maps without digitising features).
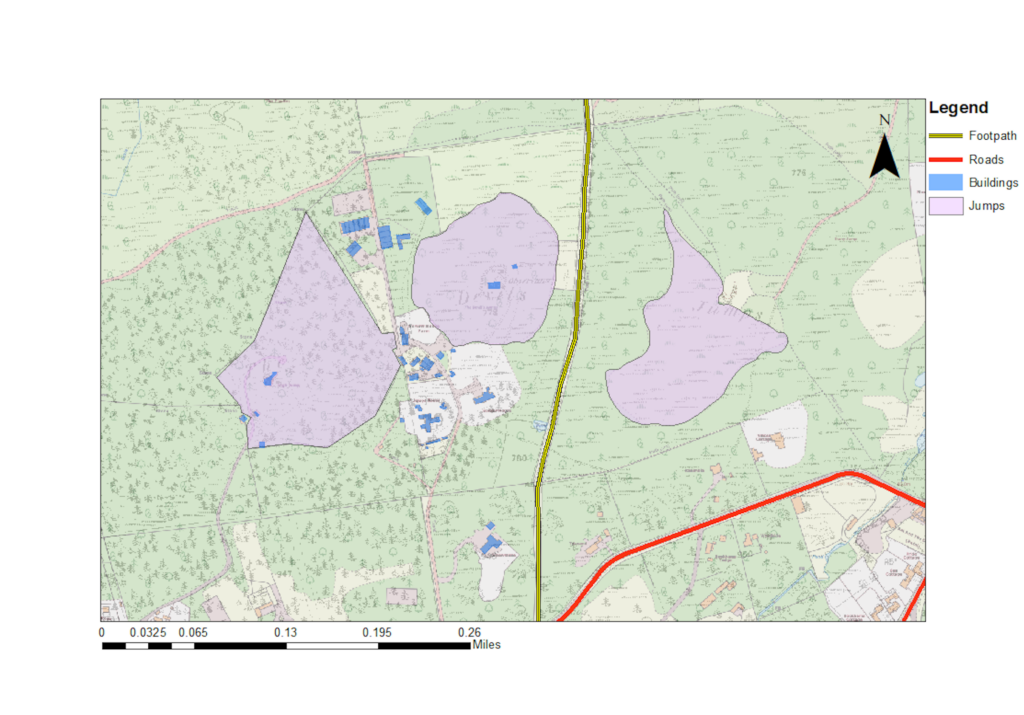
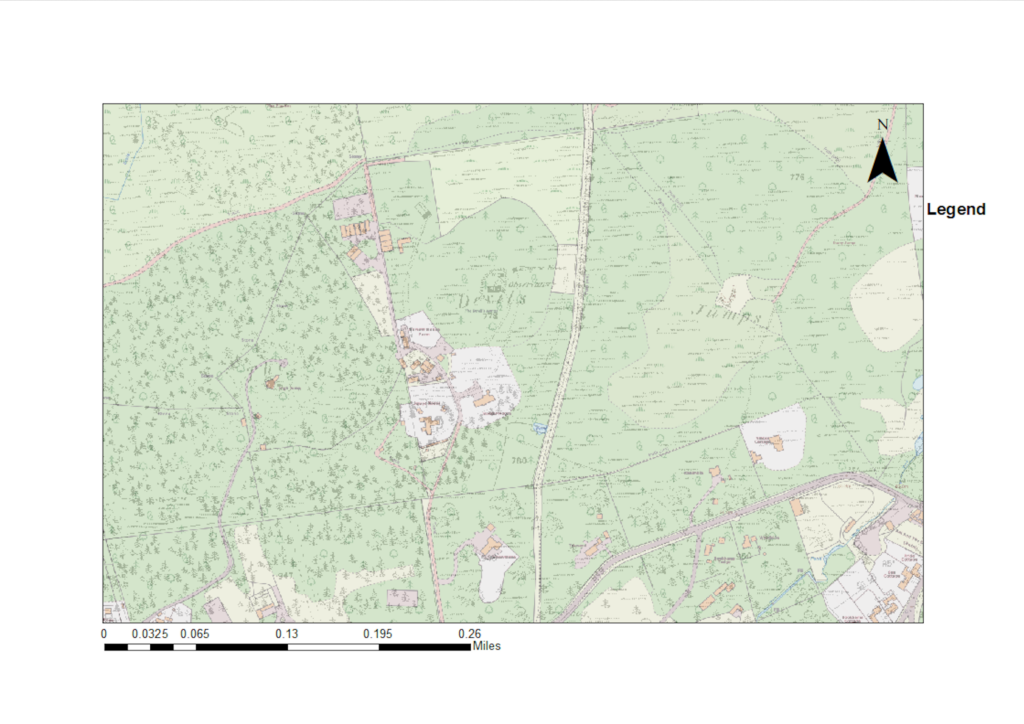
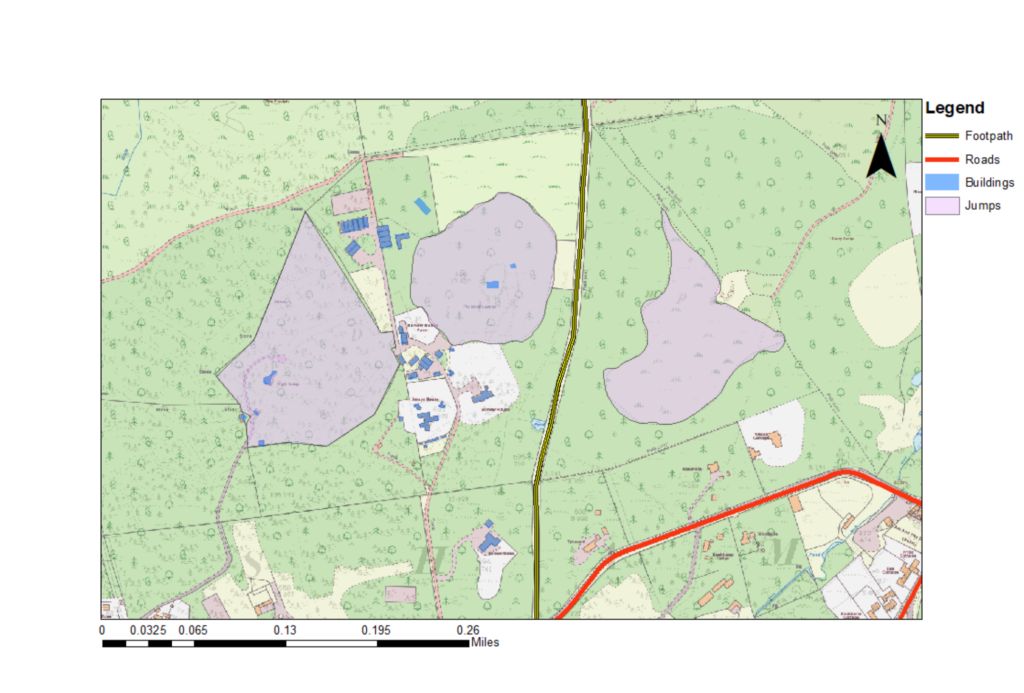
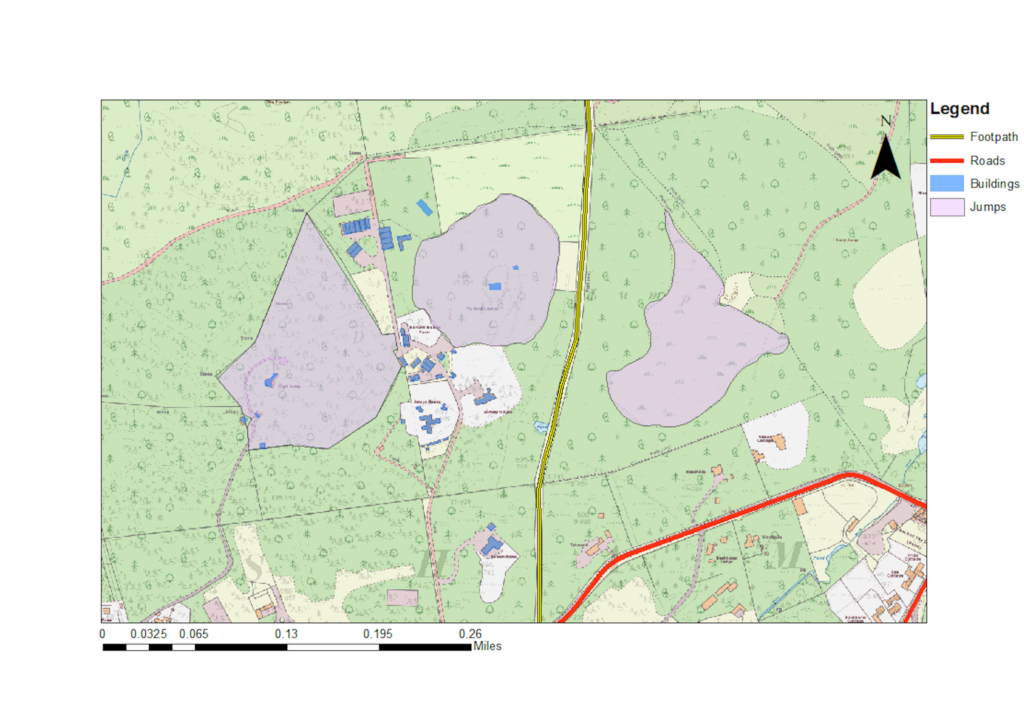
Figures 4 and 5 demonstrate the completed GIS process; after creating a singular raster and georeferencing it, I began considering which features were significant and made shape files to highlight them. I digitised the archaeological features on the historic and OS map to evidence changes in the site over time and created a legend to detail which features were emphasised; Figures 4-7 demonstrate that little change has occurred between 1846-2021. The tracing tool allows features to be digitised without covering the labelling on the map. I also changed the symbology to create a visual differentiation between the highlighted features. Symbology refers to the transformation of reality using attribute data; in GIS, this means how the data is displayed. In Figure 4, I changed the colours within the map, making the road red with the line digitising tool, the Jumps purple, the developed areas blue and the footpath yellow. Amending the raster transparency assisted with deciphering where changes occurred over time. Figure 5 presents this without symbology.
I followed the same process for Figures 6 and 7, which present changes between the OS Map and the other County Series. The digitised shape files indicate archaeological changes; the absence of significant developments are immediately obvious and is unusual over such a large timescale.
My findings here, like the Google Earth Pro project, revealed that little has changed since 1846; this is visually apparent. Supplementary information was needed to answer why there was such little change. I used the Magic Map (from DEFRA, the Department for Environment, Food and Rural Affairs) as well as the Surrey planning portal from the government website to further research interpretative materials on the area; both signified that lack of change is because the site is protected. As a site of Special Scientific Interest (SSSI) and an Area of Outstanding Natural Beauty (AONB), there are multiple parties interested in the protection and preservation of the area. The site was first granted status as a SSSI in 1981, which protects it from future developments, however, the above maps indicate that the only change in the site from 1846 has been the removal of the Observatory and Engine House, and the addition of Mushroom Tunnels and two additional homes. Even the urban areas surrounding the site have been subject to very little change; recent attempts from a property developer have also been prevented in order to maintain the natural legacy of the site, thanks to Waverley Council.
Citations for all research in this section can be found under the ‘References’ menu